Showing posts with label simple. Show all posts
Showing posts with label simple. Show all posts
Friday, April 14, 2017
Systemback Simple system backup and restore application with extra features
Systemback Simple system backup and restore application with extra features

Systemback makes it easy to create backups of system and users configuration files. In case of problems you can easily restore the previous state of the system. There are extra features like system copying, system installation and Live system creation.
Download Systemback
Go to link download

Saturday, March 25, 2017
Osueta A simple Python script to exploit the OpenSSH User Enumeration Timing Attack
Osueta A simple Python script to exploit the OpenSSH User Enumeration Timing Attack
Osueta its a simple Python2 script to exploit the OpenSSH User Enumeration Timing Attack, present in OpenSSH versions 5.* and 6.*. The script has the ability to make variations of the username employed in the bruteforce attack, and the possibility to establish a DOS condition in the OpenSSH server.
usage: osueta.py [-h] [-H HOST] [-k HFILE] [-f FQDN] [-p PORT] [-L UFILE]
 [-U USER] [-d DELAY] [-v VARI] [-o OUTP] [-l LENGTH]
 [-c VERS] [--dos DOS] [-t THREADS]

OpenSSH User Enumeration Time-Based Attack Python script

optional arguments:
-h, --help show this help message and exit
-H HOST Host Ip or CIDR netblock.
-k HFILE Host list in a file.
-f FQDN FQDN to attack.
-p PORT Host port.
-L UFILE Username list file.
-U USER Only use a single username.
-d DELAY Time delay fixed in seconds. If not, delay time is calculated.
-v VARI Make variations of the username (default yes).
-o OUTP Output file with positive results.
-l LENGTH Length of the password in characters (x1000) (default 40).
-c VERS Check or not the OpenSSH version (default yes).
--dos DOS Try to make a DOS attack (default no).
-t THREADS Threads for the DOS attack (default 5).
Download Osueta
Go to link download
Wednesday, March 15, 2017
Boost your chrome Speed on Kpn tunnelling By this simple trick
Boost your chrome Speed on Kpn tunnelling By this simple trick
WARNING: These experimental features may change, break, or disappear at any time. We make absolutely no guarantees about what may happen if you turn one of these experiments on, and your browser may even spontaneously combust. Jokes aside, your browser may delete all your data, or your security and privacy could be compromised in unexpected ways. Any experiments you enable will be enabled for all users of this browser. Please consider the risk.
Steps to follow:
1. Download the latest version of chrome .
2. Once you open visit chrome://flags
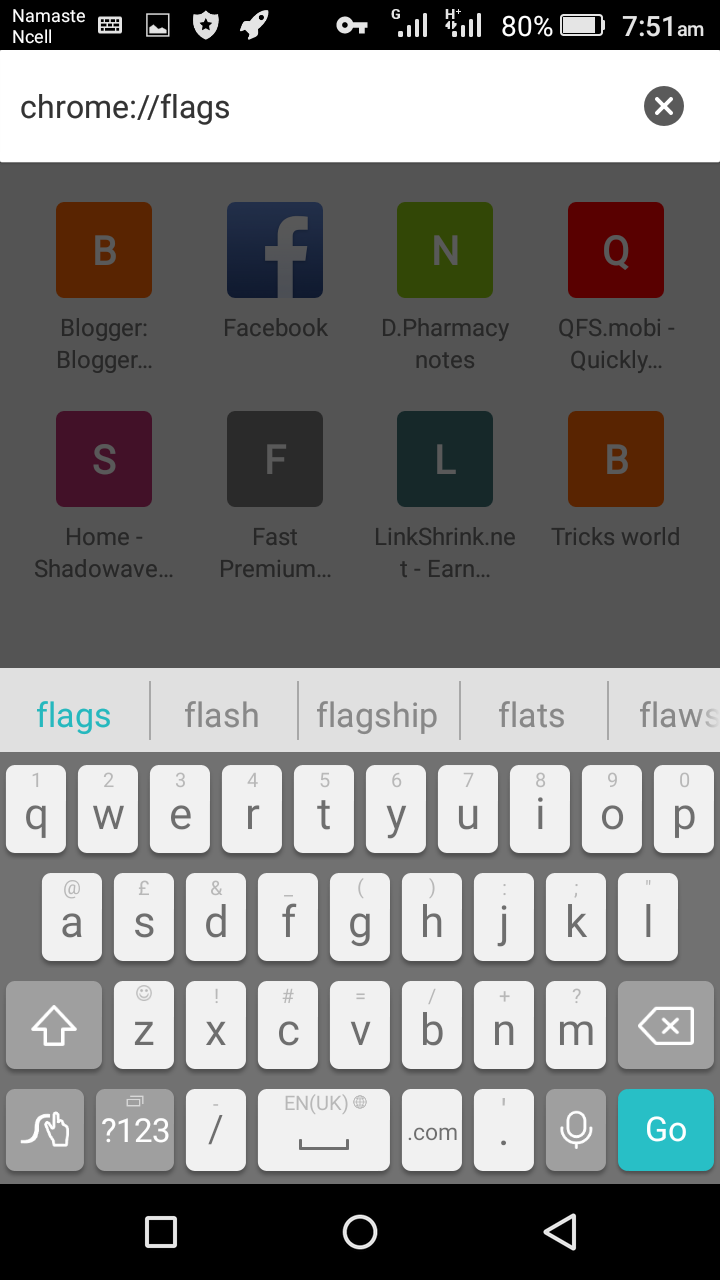
3. Once you visit the link you will find various hidden settings
4 Search for Default title width
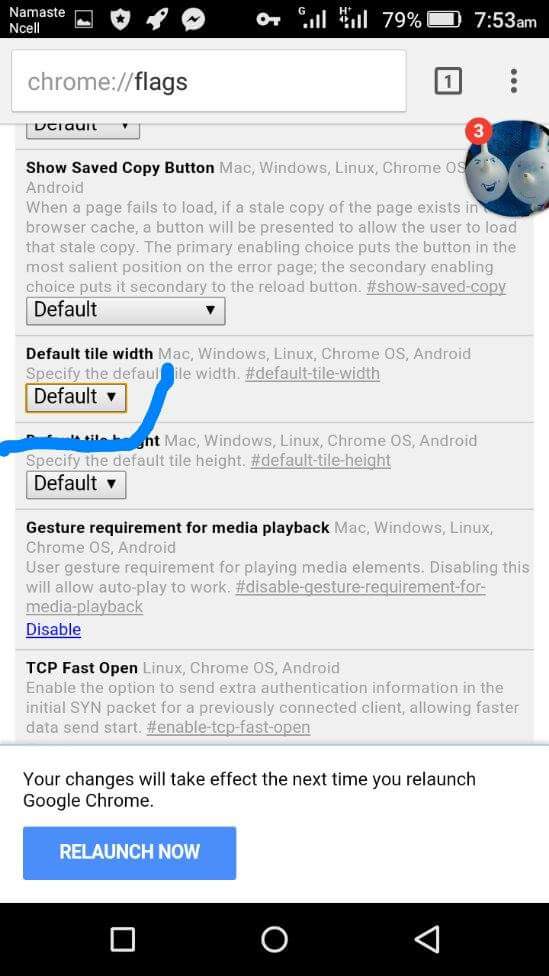
5. Click on it and turn it to 512
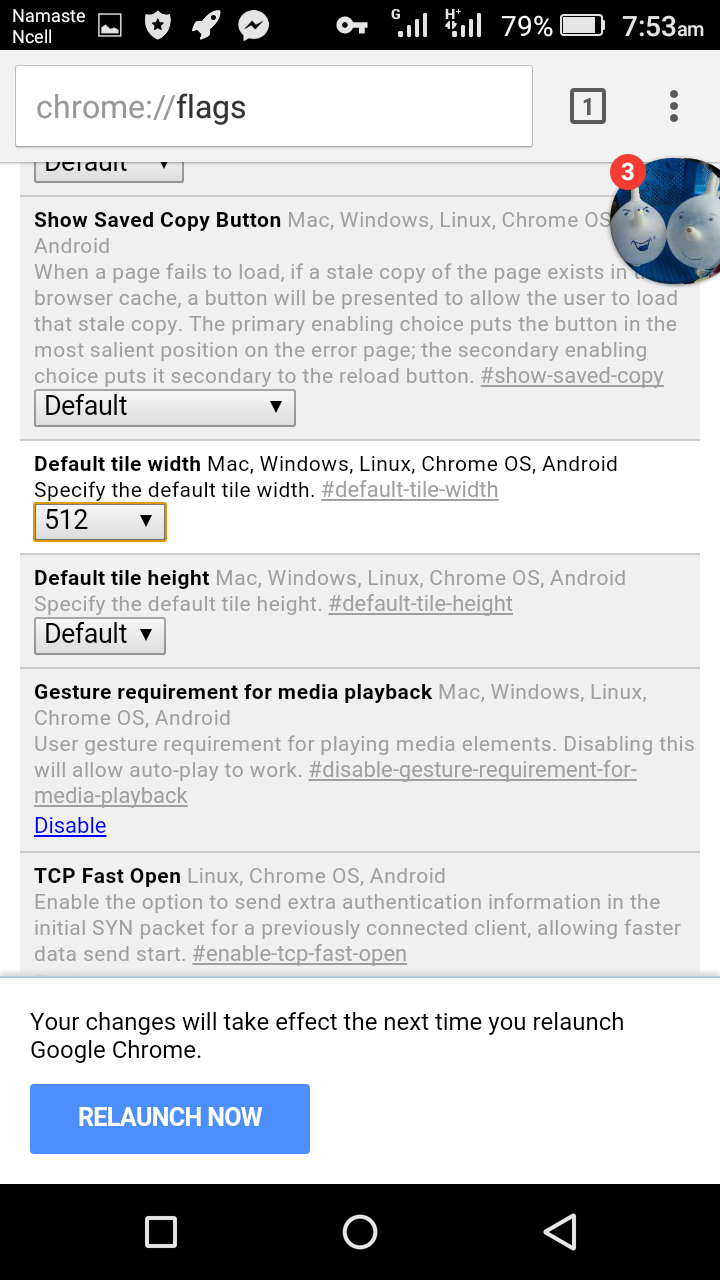
6. This is the RAM consumption taken up by Google chrome.
7. Once you do that click on the Relaunch Now button that appears at the bottom just after you change the initial values.
Boost Google chrome speed.
Note:Unless you are well aware about the rest of the settings included we do not encourage you to experiment some.
Go to link download
Monday, March 6, 2017
SimpleProgramDebugger Simple program debugger that shows all debug events
SimpleProgramDebugger Simple program debugger that shows all debug events

SimpleProgramDebugger is a simple debugging tool for Windows that attaches to existing running program or starts a new program in debugging mode, and then displays all major debugging events occurs while the program is running, including Exception, Create Thread, Create Process, Exit Thread, Exit Process, Load DLL, Unload Dll, and Debug String.
After the debugging events are accumulated, you can easily export them into comma-delimited/tab-delimited/xml/html file or copy them to the clipboard and then paste them into Excel or any other spreadsheet application.
Start Using SimpleProgramDebugger
SimpleProgramDebugger doesnt require any installation process or additional dll files. In order to start using it, simply run the executable file - SimpleProgramDebugger.exe After running SimpleProgramDebugger, you can attach a program that is already running by pressing F7 and choosing the desired process, or you can start a new program by pressing Ctrl+N and choosing the .exe file to run, and optionally parameters and start folder.
After the debugging events are displayed in the main window of SimpleProgramDebugger, you can select one or more events, and then use the Save Selected items option to export them into comma-delimited/tab-delimited/xml/html file or press Ctrl+C to copy them to the clipboard, and then paste them into Excel or any other spreadsheet application.
Download SimpleProgramDebugger
Go to link download
Subscribe to:
Posts (Atom)